
Search for Indicators
Children and Adolescent
This dashboard is a collection of all of the indicators related to health factors and outcomes for children and adolescents.
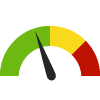
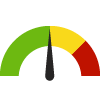
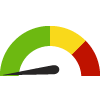
Indicator Gauge Icon Legend
Legend Colors
Red is bad, green is good, blue is not statistically different/neutral.
Compared to Distribution
 the value is in the best half of communities.
 the value is in the 2nd worst quarter of communities.
 the value is in the worst quarter of communities.
Compared to Target
 meets target;
  does not meet target.
Compared to a Single Value
 lower than the comparison value;
 higher than the comparison value;
 not statistically different from comparison value.
Trend

 non-significant change over time;
 significant change over time;
  no change over time.
Compared to Prior Value
 higher than the previous measurement period;
 lower than the previous measurement period;
 no statistically different change from previous measurement period.
Health
Experienced One Adverse Childhood Experiences (ACE) (BRFS) County: Milwaukee
Experienced One Adverse Childhood Experiences (ACE) (BRFS) County: Milwaukee
24%
Percentage of adults
(2016-2018)
Compared to:

Prior Value
(24%)
Prior Value compares a measured value with the previously measured value. Confidence intervals were taken into account in determining the direction of the comparison.
Trend
This comparison measures the indicator’s values over multiple time periods.<br>The Mann-Kendall Test for Statistical Significance is used to evaluate the trend<br>over 4 to 10 periods of measure, subject to data availability and comparability.
Experienced One or More Adverse Childhood Experiences (ACE) (BRFS) County: Milwaukee
Experienced One or More Adverse Childhood Experiences (ACE) (BRFS) County: Milwaukee
69%
Percentage of adults
(2016-2018)
Compared to:

Prior Value
(68%)
Prior Value compares a measured value with the previously measured value. Confidence intervals were taken into account in determining the direction of the comparison.
Trend
This comparison measures the indicator’s values over multiple time periods.<br>The Mann-Kendall Test for Statistical Significance is used to evaluate the trend<br>over 4 to 10 periods of measure, subject to data availability and comparability.
Experienced Two Adverse Childhood Experiences (ACE) (BRFS) County: Milwaukee
Experienced Two Adverse Childhood Experiences (ACE) (BRFS) County: Milwaukee
15%
Percentage of adults
(2016-2018)
Compared to:
Prior Value
(15%)
Prior Value compares a measured value with the previously measured value. Confidence intervals were taken into account in determining the direction of the comparison.
Trend
This comparison measures the indicator’s values over multiple time periods.<br>The Mann-Kendall Test for Statistical Significance is used to evaluate the trend<br>over 4 to 10 periods of measure, subject to data availability and comparability.
Health / Alcohol & Drug Use
Age-Adjusted ER Rate due to Adolescent Alcohol Use County: Milwaukee
Age-Adjusted ER Rate due to Adolescent Alcohol Use County: Milwaukee
4.2
ER visits per 10,000 population aged 10-17
(2020-2022)
Compared to:
WI Value
(7.6)
The regional value is compared to the Wisconsin State value.
Prior Value
(4.3)
Prior Value compares a measured value with the previously measured value. Confidence intervals were taken into account in determining the direction of the comparison.
Trend
This comparison measures the indicator’s values over multiple time periods.<br>The Mann-Kendall Test for Statistical Significance is used to evaluate the trend<br>over 4 to 10 periods of measure, subject to data availability and comparability.
Health / Alcohol & Drug Use
Age-Adjusted Hospitalization Rate due to Adolescent Alcohol Use
Value
Compared to:
Age-Adjusted Hospitalization Rate due to Adolescent Alcohol Use County: Milwaukee
Age-Adjusted Hospitalization Rate due to Adolescent Alcohol Use County: Milwaukee
2.9
Hospitalizations per 10,000 population aged 10-17
(2020-2022)
Compared to:
WI Value
(5.8)
The regional value is compared to the Wisconsin State value.
Prior Value
(3.0)
Prior Value compares a measured value with the previously measured value. Confidence intervals were taken into account in determining the direction of the comparison.
Trend
This comparison measures the indicator’s values over multiple time periods.<br>The Mann-Kendall Test for Statistical Significance is used to evaluate the trend<br>over 4 to 10 periods of measure, subject to data availability and comparability.
Death Rate due to Drug Poisoning County: Milwaukee
Death Rate due to Drug Poisoning County: Milwaukee
53.9
Deaths per 100,000 population
(2019-2021)
Compared to:


WI Counties
The distribution is based on data from 53 Wisconsin counties.
U.S. Counties
The distribution is based on data from 1,899 U.S. counties and county equivalents.
WI Value
(25.7)
The regional value is compared to the Wisconsin State value.
US Value
(27.2)
The regional value is compared to the national value.
HP 2030 Target
(20.7)
<div>SU-03: Reduce drug overdose deaths <strong>(LEADING HEALTH INDICATOR)</strong></div>
Health / Children's Health
Child Experienced Bullying in Past Year (CHS) County: Milwaukee
Child Experienced Bullying in Past Year (CHS) County: Milwaukee
16.0%
Percentage of children
(2018)
Compared to:

Prior Value
(14.0%)
Prior Value compares a measured value with the previously measured value. Confidence intervals were not taken into account in determining the direction of the comparison.
Child Experienced Verbal Bullying in Past Year (CHS) County: Milwaukee
Child Experienced Verbal Bullying in Past Year (CHS) County: Milwaukee
13.0%
Percentage of children
(2018)
Compared to:
Prior Value
(12.0%)
Prior Value compares a measured value with the previously measured value. Confidence intervals were not taken into account in determining the direction of the comparison.
Health / Children's Health
Children Consuming Three or More Vegetable Servings (CHS)
Value
Compared to:
Children Consuming Three or More Vegetable Servings (CHS) County: Milwaukee
Children Consuming Three or More Vegetable Servings (CHS) County: Milwaukee
30.0%
Percentage of children
(2015)
Compared to:

Prior Value
(31.0%)
Prior Value compares a measured value with the previously measured value. Confidence intervals were not taken into account in determining the direction of the comparison.
Children Consuming Two or More Fruit Servings (CHS) County: Milwaukee
Children Consuming Two or More Fruit Servings (CHS) County: Milwaukee
82.0%
Percentage of children
(2015)
Compared to:
Prior Value
(75.0%)
Prior Value compares a measured value with the previously measured value. Confidence intervals were not taken into account in determining the direction of the comparison.
Children Who Are Physically Active (CHS) County: Milwaukee
Children Who Are Physically Active (CHS) County: Milwaukee
58.0%
Percentage of children
(2018)
Compared to:
Prior Value
(70.0%)
Prior Value compares a measured value with the previously measured value. Confidence intervals were not taken into account in determining the direction of the comparison.
Children Who Don't Feel Safe (CHS) County: Milwaukee
Children Who Don't Feel Safe (CHS) County: Milwaukee
9.0%
Percentage of children
(2018)
Compared to:
Prior Value
(6.0%)
Prior Value compares a measured value with the previously measured value. Confidence intervals were not taken into account in determining the direction of the comparison.
Children with Current Asthma (CHS) County: Milwaukee
Children with Current Asthma (CHS) County: Milwaukee
17.0%
Percentage of children
(2018)
Compared to:
Prior Value
(11.0%)
Prior Value compares a measured value with the previously measured value. Confidence intervals were not taken into account in determining the direction of the comparison.
Children with Unmet Dental Care (CHS) County: Milwaukee
Children with Unmet Dental Care (CHS) County: Milwaukee
6.0%
Percentage of children
(2018)
Compared to:
Prior Value
(11.0%)
Prior Value compares a measured value with the previously measured value. Confidence intervals were not taken into account in determining the direction of the comparison.
Health / Disabilities
Children with a Disability County: Milwaukee
Children with a Disability County: Milwaukee
4.4%
(2018-2022)
Compared to:


WI Value
(4.1%)
The regional value is compared to the Wisconsin State value.
US Value
(4.5%)
The regional value is compared to the national value.
Trend
This comparison measures the indicator’s values over multiple time periods.<br>The Mann-Kendall Test for Statistical Significance is used to evaluate the trend<br>over 4 to 10 periods of measure, subject to data availability and comparability.
Children with a Disability State: Wisconsin
Children with a Disability State: Wisconsin
4.1%
(2018-2022)
Compared to:

US Value
(4.5%)
The regional value is compared to the national value.
Trend
This comparison measures the indicator’s values over multiple time periods.<br>The Mann-Kendall Test for Statistical Significance is used to evaluate the trend<br>over 4 to 10 periods of measure, subject to data availability and comparability.
Children with a Disability Municipality: Milwaukee
Children with a Disability Municipality: Milwaukee
4.8%
(2018-2022)
Compared to:
Milwaukee, WI County Value
(4.4%)
The regional value is compared to the Milwaukee County value.
WI Value
(4.1%)
The regional value is compared to the Wisconsin State value.
US Value
(4.5%)
The regional value is compared to the national value.
Trend
This comparison measures the indicator’s values over multiple time periods.<br>The Mann-Kendall Test for Statistical Significance is used to evaluate the trend<br>over 4 to 10 periods of measure, subject to data availability and comparability.
Children with a Disability Municipality: West Allis
Children with a Disability Municipality: West Allis
5.1%
(2018-2022)
Compared to:

Milwaukee, WI County Value
(4.4%)
The regional value is compared to the Milwaukee County value.
WI Value
(4.1%)
The regional value is compared to the Wisconsin State value.
US Value
(4.5%)
The regional value is compared to the national value.
Trend
This comparison measures the indicator’s values over multiple time periods.<br>The Mann-Kendall Test for Statistical Significance is used to evaluate the trend<br>over 4 to 10 periods of measure, subject to data availability and comparability.
Health / Family Planning
Infants Born to Mothers with <12 Years Education County: Milwaukee
Infants Born to Mothers with <12 Years Education County: Milwaukee
14.2%
(2022)
Compared to:

WI Counties
The distribution is based on data from 67 Wisconsin counties.
WI Value
(9.5%)
The regional value is compared to the Wisconsin State value.
US Value
(11.7% in 2020)
The regional value is compared to the national value. The source for the national value is Centers for Disease Control and Prevention
Prior Value
(14.0%)
Prior Value compares a measured value with the previously measured value. Confidence intervals were not taken into account in determining the direction of the comparison.
Trend
This comparison measures the indicator’s values over multiple time periods.<br>The Mann-Kendall Test for Statistical Significance is used to evaluate the trend<br>over 4 to 10 periods of measure, subject to data availability and comparability.
Infants Born to Mothers with <12 Years Education State: Wisconsin
Infants Born to Mothers with <12 Years Education State: Wisconsin
9.5%
(2022)
Compared to:
US Value
(11.7% in 2020)
The regional value is compared to the national value. The source for the national value is Centers for Disease Control and Prevention
Prior Value
(9.4%)
Prior Value compares a measured value with the previously measured value. Confidence intervals were not taken into account in determining the direction of the comparison.
Trend
This comparison measures the indicator’s values over multiple time periods.<br>The Mann-Kendall Test for Statistical Significance is used to evaluate the trend<br>over 4 to 10 periods of measure, subject to data availability and comparability.
Health / Health Care Access & Quality
Health / Health Care Access & Quality
Children Who Received Preventive Care in the Past Year (CHS)
Value
Compared to:
Children Who Received Preventive Care in the Past Year (CHS) County: Milwaukee
Children Who Received Preventive Care in the Past Year (CHS) County: Milwaukee
93.0%
Percentage of children
(2018)
Compared to:
Prior Value
(92.0%)
Prior Value compares a measured value with the previously measured value. Confidence intervals were not taken into account in determining the direction of the comparison.
Children with Health Care Provider (CHS) County: Milwaukee
Children with Health Care Provider (CHS) County: Milwaukee
95.0%
Percentage of children
(2018)
Compared to:
Prior Value
(91.0%)
Prior Value compares a measured value with the previously measured value. Confidence intervals were not taken into account in determining the direction of the comparison.
Children with Health Insurance County: Milwaukee
Children with Health Insurance County: Milwaukee
96.9%
(2022)
Compared to:

U.S. Counties
The distribution is based on data from 828 U.S. counties and county equivalents.
WI Value
(95.5%)
The regional value is compared to the Wisconsin State value.
US Value
(94.9%)
The regional value is compared to the national value.
Prior Value
(97.2%)
Prior Value compares a measured value with the previously measured value. Confidence intervals were taken into account in determining the direction of the comparison.
Trend
This comparison measures the indicator’s values over multiple time periods.<br>The Mann-Kendall Test for Statistical Significance is used to evaluate the trend<br>over 4 to 10 periods of measure, subject to data availability and comparability.
Children with Health Insurance State: Wisconsin
Children with Health Insurance State: Wisconsin
95.5%
(2022)
Compared to:
U.S. States
The distribution is based on data from 50 U.S. states and the District of Columbia.
US Value
(94.9%)
The regional value is compared to the national value.
Prior Value
(96.0%)
Prior Value compares a measured value with the previously measured value. Confidence intervals were taken into account in determining the direction of the comparison.
Trend
This comparison measures the indicator’s values over multiple time periods.<br>The Mann-Kendall Test for Statistical Significance is used to evaluate the trend<br>over 4 to 10 periods of measure, subject to data availability and comparability.
Children with Health Insurance Municipality: Milwaukee
Children with Health Insurance Municipality: Milwaukee
96.9%
(2022)
Compared to:
U.S. Counties
The distribution is based on data from 828 U.S. counties and county equivalents.
Milwaukee, WI County Value
(96.9%)
The regional value is compared to the Milwaukee County value.
WI Value
(95.5%)
The regional value is compared to the Wisconsin State value.
US Value
(94.9%)
The regional value is compared to the national value.
Prior Value
(97.4%)
Prior Value compares a measured value with the previously measured value. Confidence intervals were taken into account in determining the direction of the comparison.
Trend
This comparison measures the indicator’s values over multiple time periods.<br>The Mann-Kendall Test for Statistical Significance is used to evaluate the trend<br>over 4 to 10 periods of measure, subject to data availability and comparability.
Currently Has Insurance (FHS) County: Milwaukee
Currently Has Insurance (FHS) County: Milwaukee
92%
Percentage of people
(2018)
Compared to:
Prior Value
(94%)
Prior Value compares a measured value with the previously measured value. Confidence intervals were taken into account in determining the direction of the comparison.
Trend
This comparison measures the indicator’s values over multiple time periods.<br>The Mann-Kendall Test for Statistical Significance is used to evaluate the trend<br>over 4 to 10 periods of measure, subject to data availability and comparability.
Persons with Health Insurance County: Milwaukee
Persons with Health Insurance County: Milwaukee
91.8%
(2021)
Compared to:

WI Counties
The distribution is based on data from 72 Wisconsin counties.
U.S. Counties
The distribution is based on data from 3,140 U.S. counties and county equivalents.
WI Value
(93.5%)
The regional value is compared to the Wisconsin State value.
Prior Value
(91.7%)
Prior Value compares a measured value with the previously measured value. Confidence intervals were taken into account in determining the direction of the comparison.
Trend
This comparison measures the indicator’s values over multiple time periods.<br>The Mann-Kendall Test for Statistical Significance is used to evaluate the trend<br>over 4 to 10 periods of measure, subject to data availability and comparability.
HP 2030 Target
(92.4%)
<div>AHS-01: Increase the proportion of people with health insurance <strong>(LEADING HEALTH INDICATOR)</strong></div>
Persons with Health Insurance State: Wisconsin
Persons with Health Insurance State: Wisconsin
93.5%
(2021)
Compared to:
U.S. States
The distribution is based on data from 50 U.S. states and the District of Columbia.
Prior Value
(93.2%)
Prior Value compares a measured value with the previously measured value. Confidence intervals were taken into account in determining the direction of the comparison.
Trend
This comparison measures the indicator’s values over multiple time periods.<br>The Mann-Kendall Test for Statistical Significance is used to evaluate the trend<br>over 4 to 10 periods of measure, subject to data availability and comparability.
HP 2030 Target
(92.4%)
<div>AHS-01: Increase the proportion of people with health insurance <strong>(LEADING HEALTH INDICATOR)</strong></div>
Routine Checkup within the Past Year (FHS) County: Milwaukee
Routine Checkup within the Past Year (FHS) County: Milwaukee
77%
Percentage of people
(2018)
Compared to:
Prior Value
(78%)
Prior Value compares a measured value with the previously measured value. Confidence intervals were taken into account in determining the direction of the comparison.
Trend
This comparison measures the indicator’s values over multiple time periods.<br>The Mann-Kendall Test for Statistical Significance is used to evaluate the trend<br>over 4 to 10 periods of measure, subject to data availability and comparability.
Health / Immunizations & Infectious Diseases
Health / Immunizations & Infectious Diseases
Persons Fully Vaccinated Against COVID-19
Value
Compared to:
Persons Fully Vaccinated Against COVID-19 County: Milwaukee
Persons Fully Vaccinated Against COVID-19 County: Milwaukee
67.9%
(May 10, 2023)
Compared to:
WI Counties
The distribution is based on data from 72 Wisconsin counties.
U.S. Counties
The distribution is based on data from 3,125 U.S. counties and county equivalents.
Prior Value
(67.9%)
Prior Value compares a measured value with the previously measured value. Confidence intervals were not taken into account in determining the direction of the comparison.
Trend
This comparison measures the indicator’s values over multiple time periods.<br>The Mann-Kendall Test for Statistical Significance is used to evaluate the trend<br>over 4 to 10 periods of measure, subject to data availability and comparability.
Health / Maternal, Fetal & Infant Health
Babies with Low Birthweight County: Milwaukee
Babies with Low Birthweight County: Milwaukee
11.2%
(2022)
Compared to:
WI Counties
The distribution is based on data from 68 Wisconsin counties.
WI Value
(8.0%)
The regional value is compared to the Wisconsin State value.
US Value
(8.5% in 2021)
The regional value is compared to the national value. The source for the national value is Centers for Disease Control and Prevention
Prior Value
(10.6%)
Prior Value compares a measured value with the previously measured value. Confidence intervals were taken into account in determining the direction of the comparison.
Trend
This comparison measures the indicator’s values over multiple time periods.<br>The Mann-Kendall Test for Statistical Significance is used to evaluate the trend<br>over 4 to 10 periods of measure, subject to data availability and comparability.
Babies with Low Birthweight State: Wisconsin
Babies with Low Birthweight State: Wisconsin
8.0%
(2022)
Compared to:
US Value
(8.5% in 2021)
The regional value is compared to the national value. The source for the national value is Centers for Disease Control and Prevention
Prior Value
(7.7%)
Prior Value compares a measured value with the previously measured value. Confidence intervals were taken into account in determining the direction of the comparison.
Trend
This comparison measures the indicator’s values over multiple time periods.<br>The Mann-Kendall Test for Statistical Significance is used to evaluate the trend<br>over 4 to 10 periods of measure, subject to data availability and comparability.
Babies with Very Low Birthweight County: Milwaukee
Babies with Very Low Birthweight County: Milwaukee
1.9%
(2022)
Compared to:
WI Value
(1.3%)
The regional value is compared to the Wisconsin State value.
US Value
(1.4% in 2021)
The regional value is compared to the national value. The source for the national value is Centers for Disease Control and Prevention
Prior Value
(1.9%)
Prior Value compares a measured value with the previously measured value. Confidence intervals were taken into account in determining the direction of the comparison.
Trend
This comparison measures the indicator’s values over multiple time periods.<br>The Mann-Kendall Test for Statistical Significance is used to evaluate the trend<br>over 4 to 10 periods of measure, subject to data availability and comparability.
Babies with Very Low Birthweight State: Wisconsin
Babies with Very Low Birthweight State: Wisconsin
1.3%
(2022)
Compared to:
US Value
(1.4% in 2021)
The regional value is compared to the national value. The source for the national value is Centers for Disease Control and Prevention
Prior Value
(1.3%)
Prior Value compares a measured value with the previously measured value. Confidence intervals were taken into account in determining the direction of the comparison.
Trend
This comparison measures the indicator’s values over multiple time periods.<br>The Mann-Kendall Test for Statistical Significance is used to evaluate the trend<br>over 4 to 10 periods of measure, subject to data availability and comparability.
Infant Mortality Rate County: Milwaukee
Infant Mortality Rate County: Milwaukee
8.0
Deaths per 1,000 live births
(2020-2022)
Compared to:
WI Counties
The distribution is based on data from 68 Wisconsin counties.
WI Value
(5.6)
The regional value is compared to the Wisconsin State value.
US Value
(5.4 in 2021)
The regional value is compared to the national value. The source for the national value is Centers for Disease Control and Prevention
Prior Value
(7.9)
Prior Value compares a measured value with the previously measured value. Confidence intervals were taken into account in determining the direction of the comparison.
Trend
This comparison measures the indicator’s values over multiple time periods.<br>The Mann-Kendall Test for Statistical Significance is used to evaluate the trend<br>over 4 to 10 periods of measure, subject to data availability and comparability.
HP 2030 Target
(5.0)
<div>MICH-02: Reduce the rate of infant deaths <strong>(LEADING HEALTH INDICATOR)</strong></div>
Infant Mortality Rate State: Wisconsin
Infant Mortality Rate State: Wisconsin
5.6
Deaths per 1,000 live births
(2020-2022)
Compared to:
US Value
(5.4 in 2021)
The regional value is compared to the national value. The source for the national value is Centers for Disease Control and Prevention
Prior Value
(5.7)
Prior Value compares a measured value with the previously measured value. Confidence intervals were taken into account in determining the direction of the comparison.
Trend
This comparison measures the indicator’s values over multiple time periods.<br>The Mann-Kendall Test for Statistical Significance is used to evaluate the trend<br>over 4 to 10 periods of measure, subject to data availability and comparability.
HP 2030 Target
(5.0)
<div>MICH-02: Reduce the rate of infant deaths <strong>(LEADING HEALTH INDICATOR)</strong></div>
Preterm Births County: Milwaukee
Preterm Births County: Milwaukee
11.3%
(2022)
Compared to:

WI Counties
The distribution is based on data from 71 Wisconsin counties.
WI Value
(10.2%)
The regional value is compared to the Wisconsin State value.
US Value
(10.5% in 2021)
The regional value is compared to the national value. The source for the national value is Centers for Disease Control and Prevention
Prior Value
(11.2%)
Prior Value compares a measured value with the previously measured value. Confidence intervals were taken into account in determining the direction of the comparison.
Trend
This comparison measures the indicator’s values over multiple time periods.<br>The Mann-Kendall Test for Statistical Significance is used to evaluate the trend<br>over 4 to 10 periods of measure, subject to data availability and comparability.
HP 2030 Target
(9.4%)
Preterm Births State: Wisconsin
Preterm Births State: Wisconsin
10.2%
(2022)
Compared to:
US Value
(10.5% in 2021)
The regional value is compared to the national value. The source for the national value is Centers for Disease Control and Prevention
Prior Value
(10.0%)
Prior Value compares a measured value with the previously measured value. Confidence intervals were taken into account in determining the direction of the comparison.
Trend
This comparison measures the indicator’s values over multiple time periods.<br>The Mann-Kendall Test for Statistical Significance is used to evaluate the trend<br>over 4 to 10 periods of measure, subject to data availability and comparability.
HP 2030 Target
(9.4%)
Health / Maternal, Fetal & Infant Health
Preterm Labor and Delivery Hospitalizations
Value
Compared to:
Preterm Labor and Delivery Hospitalizations County: Milwaukee
Preterm Labor and Delivery Hospitalizations County: Milwaukee
4.5%
(2020-2022)
Compared to:
WI Counties
The distribution is based on data from 53 Wisconsin counties.
WI Value
(3.5%)
The regional value is compared to the Wisconsin State value.
Prior Value
(4.6%)
Prior Value compares a measured value with the previously measured value. Confidence intervals were taken into account in determining the direction of the comparison.
Trend
This comparison measures the indicator’s values over multiple time periods.<br>The Mann-Kendall Test for Statistical Significance is used to evaluate the trend<br>over 4 to 10 periods of measure, subject to data availability and comparability.
Health / Mental Health & Mental Disorders
Health / Mental Health & Mental Disorders
Age-Adjusted ER Rate due to Adolescent Suicide and Intentional Self-inflicted Injury
Value
Compared to:
Age-Adjusted ER Rate due to Adolescent Suicide and Intentional Self-inflicted Injury County: Milwaukee
Age-Adjusted ER Rate due to Adolescent Suicide and Intentional Self-inflicted Injury County: Milwaukee
59.8
ER visits per 10,000 population aged 10-17
(2020-2022)
Compared to:
WI Counties
The distribution is based on data from 72 Wisconsin counties.
WI Value
(106.3)
The regional value is compared to the Wisconsin State value.
Prior Value
(63.6)
Prior Value compares a measured value with the previously measured value. Confidence intervals were taken into account in determining the direction of the comparison.
Trend
This comparison measures the indicator’s values over multiple time periods.<br>The Mann-Kendall Test for Statistical Significance is used to evaluate the trend<br>over 4 to 10 periods of measure, subject to data availability and comparability.
Health / Mental Health & Mental Disorders
Age-Adjusted ER Rate due to Pediatric Mental Health
Value
Compared to:
Age-Adjusted ER Rate due to Pediatric Mental Health County: Milwaukee
Age-Adjusted ER Rate due to Pediatric Mental Health County: Milwaukee
51.9
ER visits per 10,000 population under 18 years
(2020-2022)
Compared to:
WI Counties
The distribution is based on data from 70 Wisconsin counties.
WI Value
(30.8)
The regional value is compared to the Wisconsin State value.
Prior Value
(60.6)
Prior Value compares a measured value with the previously measured value. Confidence intervals were taken into account in determining the direction of the comparison.
Trend
This comparison measures the indicator’s values over multiple time periods.<br>The Mann-Kendall Test for Statistical Significance is used to evaluate the trend<br>over 4 to 10 periods of measure, subject to data availability and comparability.
Health / Mental Health & Mental Disorders
Age-Adjusted Hospitalization Rate due to Adolescent Suicide and Intentional Self-inflicted Injury
Value
Compared to:
Age-Adjusted Hospitalization Rate due to Adolescent Suicide and Intentional Self-inflicted Injury County: Milwaukee
Age-Adjusted Hospitalization Rate due to Adolescent Suicide and Intentional Self-inflicted Injury County: Milwaukee
41.2
Hospitalizations per 10,000 population aged 10-17
(2020-2022)
Compared to:
WI Counties
The distribution is based on data from 71 Wisconsin counties.
WI Value
(72.7)
The regional value is compared to the Wisconsin State value.
Prior Value
(41.9)
Prior Value compares a measured value with the previously measured value. Confidence intervals were taken into account in determining the direction of the comparison.
Trend
This comparison measures the indicator’s values over multiple time periods.<br>The Mann-Kendall Test for Statistical Significance is used to evaluate the trend<br>over 4 to 10 periods of measure, subject to data availability and comparability.
Health / Mental Health & Mental Disorders
Age-Adjusted Hospitalization Rate due to Pediatric Mental Health
Value
Compared to:
Age-Adjusted Hospitalization Rate due to Pediatric Mental Health County: Milwaukee
Age-Adjusted Hospitalization Rate due to Pediatric Mental Health County: Milwaukee
58.7
Hospitalizations per 10,000 population under 18 years
(2020-2022)
Compared to:
WI Counties
The distribution is based on data from 71 Wisconsin counties.
WI Value
(53.5)
The regional value is compared to the Wisconsin State value.
Prior Value
(68.8)
Prior Value compares a measured value with the previously measured value. Confidence intervals were taken into account in determining the direction of the comparison.
Trend
This comparison measures the indicator’s values over multiple time periods.<br>The Mann-Kendall Test for Statistical Significance is used to evaluate the trend<br>over 4 to 10 periods of measure, subject to data availability and comparability.
Health / Oral Health
Dental Visit in the Past Year (FHS) County: Milwaukee
Dental Visit in the Past Year (FHS) County: Milwaukee
74%
Percentage of people
(2018)
Compared to:
Prior Value
(69%)
Prior Value compares a measured value with the previously measured value. Confidence intervals were taken into account in determining the direction of the comparison.
Trend
This comparison measures the indicator’s values over multiple time periods.<br>The Mann-Kendall Test for Statistical Significance is used to evaluate the trend<br>over 4 to 10 periods of measure, subject to data availability and comparability.
Health / Respiratory Diseases
Age-Adjusted ER Rate due to Pediatric Asthma County: Milwaukee
Age-Adjusted ER Rate due to Pediatric Asthma County: Milwaukee
54.7
ER visits per 10,000 population under 18 years
(2020-2022)
Compared to:
WI Counties
The distribution is based on data from 68 Wisconsin counties.
WI Value
(22.9)
The regional value is compared to the Wisconsin State value.
Prior Value
(58.1)
Prior Value compares a measured value with the previously measured value. Confidence intervals were taken into account in determining the direction of the comparison.
Trend
This comparison measures the indicator’s values over multiple time periods.<br>The Mann-Kendall Test for Statistical Significance is used to evaluate the trend<br>over 4 to 10 periods of measure, subject to data availability and comparability.
Health / Respiratory Diseases
Age-Adjusted Hospitalization Rate due to Pediatric Asthma
Value
Compared to:
Age-Adjusted Hospitalization Rate due to Pediatric Asthma County: Milwaukee
Age-Adjusted Hospitalization Rate due to Pediatric Asthma County: Milwaukee
6.2
Hospitalizations per 10,000 population under 18 years
(2020-2022)
Compared to:
WI Value
(2.3)
The regional value is compared to the Wisconsin State value.
Prior Value
(4.6)
Prior Value compares a measured value with the previously measured value. Confidence intervals were taken into account in determining the direction of the comparison.
Trend
This comparison measures the indicator’s values over multiple time periods.<br>The Mann-Kendall Test for Statistical Significance is used to evaluate the trend<br>over 4 to 10 periods of measure, subject to data availability and comparability.
Economy / Poverty
Children Living Below Poverty Level County: Milwaukee
Children Living Below Poverty Level County: Milwaukee
25.0%
(2018-2022)
Compared to:
WI Counties
The distribution is based on data from 72 Wisconsin counties.
U.S. Counties
The distribution is based on data from 3,132 U.S. counties and county equivalents.
WI Value
(13.3%)
The regional value is compared to the Wisconsin State value.
US Value
(16.7%)
The regional value is compared to the national value.
Trend
This comparison measures the indicator’s values over multiple time periods.<br>The Mann-Kendall Test for Statistical Significance is used to evaluate the trend<br>over 4 to 10 periods of measure, subject to data availability and comparability.
Children Living Below Poverty Level State: Wisconsin
Children Living Below Poverty Level State: Wisconsin
13.3%
(2018-2022)
Compared to:

U.S. States
The distribution is based on data from 50 U.S. states and the District of Columbia.
US Value
(16.7%)
The regional value is compared to the national value.
Trend
This comparison measures the indicator’s values over multiple time periods.<br>The Mann-Kendall Test for Statistical Significance is used to evaluate the trend<br>over 4 to 10 periods of measure, subject to data availability and comparability.
Children Living Below Poverty Level Municipality: Milwaukee
Children Living Below Poverty Level Municipality: Milwaukee
33.4%
(2018-2022)
Compared to:
WI Census Places
The distribution is based on data from 764 locales.
U.S. Census Places
The distribution is based on data from 27,556 U.S. Census Places.
Milwaukee, WI County Value
(25.0%)
The regional value is compared to the Milwaukee County value.
WI Value
(13.3%)
The regional value is compared to the Wisconsin State value.
US Value
(16.7%)
The regional value is compared to the national value.
Trend
This comparison measures the indicator’s values over multiple time periods.<br>The Mann-Kendall Test for Statistical Significance is used to evaluate the trend<br>over 4 to 10 periods of measure, subject to data availability and comparability.
Children Living Below Poverty Level Municipality: West Allis
Children Living Below Poverty Level Municipality: West Allis
10.4%
(2018-2022)
Compared to:
WI Census Places
The distribution is based on data from 764 locales.
U.S. Census Places
The distribution is based on data from 27,556 U.S. Census Places.
Milwaukee, WI County Value
(25.0%)
The regional value is compared to the Milwaukee County value.
WI Value
(13.3%)
The regional value is compared to the Wisconsin State value.
US Value
(16.7%)
The regional value is compared to the national value.
Trend
This comparison measures the indicator’s values over multiple time periods.<br>The Mann-Kendall Test for Statistical Significance is used to evaluate the trend<br>over 4 to 10 periods of measure, subject to data availability and comparability.
Young Children Living Below Poverty Level County: Milwaukee
Young Children Living Below Poverty Level County: Milwaukee
26.2%
(2018-2022)
Compared to:
WI Counties
The distribution is based on data from 72 Wisconsin counties.
U.S. Counties
The distribution is based on data from 3,131 U.S. counties and county equivalents.
WI Value
(14.9%)
The regional value is compared to the Wisconsin State value.
US Value
(18.1%)
The regional value is compared to the national value.
Trend
This comparison measures the indicator’s values over multiple time periods.<br>The Mann-Kendall Test for Statistical Significance is used to evaluate the trend<br>over 4 to 10 periods of measure, subject to data availability and comparability.
Young Children Living Below Poverty Level State: Wisconsin
Young Children Living Below Poverty Level State: Wisconsin
14.9%
(2018-2022)
Compared to:
U.S. States
The distribution is based on data from 50 U.S. states and the District of Columbia.
US Value
(18.1%)
The regional value is compared to the national value.
Trend
This comparison measures the indicator’s values over multiple time periods.<br>The Mann-Kendall Test for Statistical Significance is used to evaluate the trend<br>over 4 to 10 periods of measure, subject to data availability and comparability.
Young Children Living Below Poverty Level Municipality: Milwaukee
Young Children Living Below Poverty Level Municipality: Milwaukee
35.2%
(2018-2022)
Compared to:
WI Census Places
The distribution is based on data from 732 locales.
U.S. Census Places
The distribution is based on data from 25,402 U.S. Census Places.
Milwaukee, WI County Value
(26.2%)
The regional value is compared to the Milwaukee County value.
WI Value
(14.9%)
The regional value is compared to the Wisconsin State value.
US Value
(18.1%)
The regional value is compared to the national value.
Trend
This comparison measures the indicator’s values over multiple time periods.<br>The Mann-Kendall Test for Statistical Significance is used to evaluate the trend<br>over 4 to 10 periods of measure, subject to data availability and comparability.
Young Children Living Below Poverty Level Municipality: West Allis
Young Children Living Below Poverty Level Municipality: West Allis
9.8%
(2018-2022)
Compared to:
WI Census Places
The distribution is based on data from 732 locales.
U.S. Census Places
The distribution is based on data from 25,402 U.S. Census Places.
Milwaukee, WI County Value
(26.2%)
The regional value is compared to the Milwaukee County value.
WI Value
(14.9%)
The regional value is compared to the Wisconsin State value.
US Value
(18.1%)
The regional value is compared to the national value.
Trend
This comparison measures the indicator’s values over multiple time periods.<br>The Mann-Kendall Test for Statistical Significance is used to evaluate the trend<br>over 4 to 10 periods of measure, subject to data availability and comparability.
Youth not in School or Working County: Milwaukee
Youth not in School or Working County: Milwaukee
1.0%
(2018-2022)
Compared to:
WI Counties
The distribution is based on data from 72 Wisconsin counties.
U.S. Counties
The distribution is based on data from 3,130 U.S. counties and county equivalents.
WI Value
(1.3%)
The regional value is compared to the Wisconsin State value.
US Value
(1.8%)
The regional value is compared to the national value.
Trend
This comparison measures the indicator’s values over multiple time periods.<br>The Mann-Kendall Test for Statistical Significance is used to evaluate the trend<br>over 4 to 10 periods of measure, subject to data availability and comparability.
Youth not in School or Working State: Wisconsin
Youth not in School or Working State: Wisconsin
1.3%
(2018-2022)
Compared to:
U.S. States
The distribution is based on data from 50 U.S. states and the District of Columbia.
US Value
(1.8%)
The regional value is compared to the national value.
Trend
This comparison measures the indicator’s values over multiple time periods.<br>The Mann-Kendall Test for Statistical Significance is used to evaluate the trend<br>over 4 to 10 periods of measure, subject to data availability and comparability.
Youth not in School or Working Municipality: Milwaukee
Youth not in School or Working Municipality: Milwaukee
1.0%
(2018-2022)
Compared to:
U.S. Census Places
(2015-2019)
The distribution is based on data from 26,145 U.S. Census Places.
Milwaukee, WI County Value
(1.0%)
The regional value is compared to the Milwaukee County value.
WI Value
(1.3%)
The regional value is compared to the Wisconsin State value.
US Value
(1.8%)
The regional value is compared to the national value.
Trend
This comparison measures the indicator’s values over multiple time periods.<br>The Mann-Kendall Test for Statistical Significance is used to evaluate the trend<br>over 4 to 10 periods of measure, subject to data availability and comparability.
Youth not in School or Working Municipality: West Allis
Youth not in School or Working Municipality: West Allis
3.8%
(2018-2022)
Compared to:
U.S. Census Places
(2015-2019)
The distribution is based on data from 26,145 U.S. Census Places.
Milwaukee, WI County Value
(1.0%)
The regional value is compared to the Milwaukee County value.
WI Value
(1.3%)
The regional value is compared to the Wisconsin State value.
US Value
(1.8%)
The regional value is compared to the national value.
Trend
This comparison measures the indicator’s values over multiple time periods.<br>The Mann-Kendall Test for Statistical Significance is used to evaluate the trend<br>over 4 to 10 periods of measure, subject to data availability and comparability.
Youth not in School or Working Census Tract: 55079050102
Youth not in School or Working Census Tract: 55079050102
0.0%
(2015-2019)
Compared to:
U.S. Census Tracts
The distribution is based on data from 71,866 U.S. census tracts.
Milwaukee, WI County Value
(7.3%)
The regional value is compared to the Milwaukee County value.
Youth not in School or Working Census Tract: 55079160100
Youth not in School or Working Census Tract: 55079160100
0.0%
(2015-2019)
Compared to:
U.S. Census Tracts
The distribution is based on data from 71,866 U.S. census tracts.
Milwaukee, WI County Value
(7.3%)
The regional value is compared to the Milwaukee County value.
Youth not in School or Working Census Tract: 55079160204
Youth not in School or Working Census Tract: 55079160204
21.9%
(2015-2019)
Compared to:
U.S. Census Tracts
The distribution is based on data from 71,866 U.S. census tracts.
Milwaukee, WI County Value
(7.3%)
The regional value is compared to the Milwaukee County value.
Youth not in School or Working Census Tract: 55079160300
Youth not in School or Working Census Tract: 55079160300
2.9%
(2015-2019)
Compared to:
U.S. Census Tracts
The distribution is based on data from 71,866 U.S. census tracts.
Milwaukee, WI County Value
(7.3%)
The regional value is compared to the Milwaukee County value.
